Introducing Goal Expectation
It’s Sunday afternoon, you are heading home trying to catch the end of the match on TV but traffic is holding you back. By the time you get home, the final whistle was blown and you manage to catch a glimpse of the match statistics screen. Your team had 12 shots, with 8 on target yet they only drew 1-1.
“Their keeper must have played a blinder”, you think to yourself. Well, possibly. But then again, maybe not. It depends on where those 12 shots were taken from.
If they were taken from way outside the box and tamely reached the opposition goal, then they don’t really count for much, do they? On the other hand, if the opposition goalie had just saved 7 1-on-1s, well that’s different. In effect, some shots or chances in general are worth more than others.
While discussing this with Colin Trainor (do follow him at @colinttrainor), we realised that a shot - or a shot on target for that matter - is not an adequate metric. Some shots have a higher probability of being converted into goals whereas others a much lower one.
As a result, we came up with a metric which considers a number of important factors affecting the chance of a particular shot being scored and assigns a figure for the probability of a goal (or the shot’s goal expectation) and named it ExpG. The exact calculations of ExpG will remain private as a lot of work between us has been dedicated to its creation.
ExpG and Shooting Efficiency
The reason behind the introduction of ExpG would be to provide a metric that chances / strikers / teams can be compared on. If a striker has a 25% conversion rate, that does not mean that he is a better finisher compared to someone with a 20% conversion rate. Perhaps his chances were from more favourable positions compared to the other striker’s chances. Therefore unless we somehow break down the conversion rate (e.g. shots from inside/outside the area) and look at those individual figures, we would be comparing apples with oranges.
The proposed metric ExpG alleviates part of this problem. If a player, given the chances he was presented with, had an ExpG of 10.3 goals, he would be expected to score around 10 goals. If he managed to get on the scoresheet 12 times it could mean that he is an above average finisher whereas a player who only managed 12 goals while he was expected to score ExpG = 16.4 goals, would be considered as inferior.
An efficiency measure can be introduced here by dividing the number of goals a player or team has scored – excluding own goals when looking at team efficiency – by the number of goals that player or team was expected to score. An average player or team, in terms of efficiency, would have ratings equal to 1
Colin briefly introduced ExpG in his piece here and previously here so the purpose of this piece is to delve a little bit deeper and present some of our analysis and results.
Potential explanations for some of the results are offered but it has to be stressed here that this is very much work under progress therefore ExpG are always likely to be updated depending on what our research uncovers.
Shooting Efficiency Across Leagues
Without further ado, we start by looking at the shooting efficiency figures across the top divisions in England, France, Germany, Italy and Spain for the 2012-2013 season. For comparison purposes we can look at the deviation of each shooting efficiency figure from 1.00.
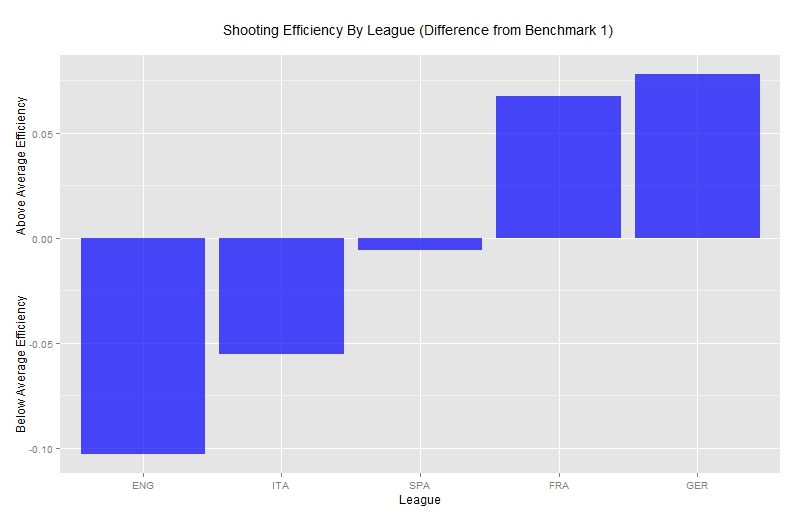
Based on our measure of shooting efficiency, it would seem that players in the English league are on average more inefficient i.e. they score fewer goals (approximately 10% fewer) than what they would be expected to score given the chances they are presented with, compared to players from other leagues. Germany appears in the opposite end of the spectrum of shooting efficiency and in fact this has also been mentioned by others such as Ted Knutson in his piece here.
Not the first time the words “Germany” and “efficiency” appear in the same sentence, I guess!
One potential issue to consider here which is not taken into account in our analysis due to shortage of available data is the effect the defensive organization of a team, including the defenders’ positioning or defensive pressure has on ExpG. Faced with better defenders, a striker might be less likely to score a goal compared to when he faces a team with average defensive capabilities. This could potentially be a factor explaining the below average efficiency in England and Italy as identified by Colin himself at in his article here.
Shooting Efficiency By Team
If we now turn our attention to the team level, shooting efficiency for all 98 teams in these leagues follows a reasonably symmetric and roughly Normal distribution with the majority of teams exhibiting around average efficiency.
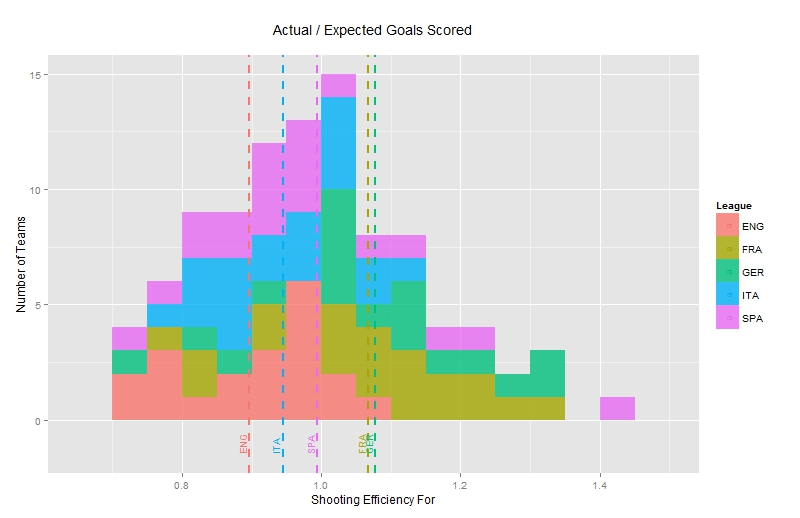
For comparison purposes, league average efficiency figures have been included as dashed lines and correspond to the previous plot. A lot has been said about the Barcelona team of recent years and they excel in this metric with a shooting efficiency of 1.44. Having first accounted for a number of factors through this analysis, Barcelona’s conversion of chances remains very high and while part of this may be down to the quality of strikers they possess, interestingly enough even a Messi-less Barcelona registers a shooting efficiency of 1.35. On the other hand, only 3 English teams register an above-average attacking shooting efficiency.
A different way of visualizing the results is by plotting the expected versus the actual goals per match scored by each team – having first excluded own goals. Note that the number of expected goals for a team is simply the sum of ExpG for all of their attempted shots.
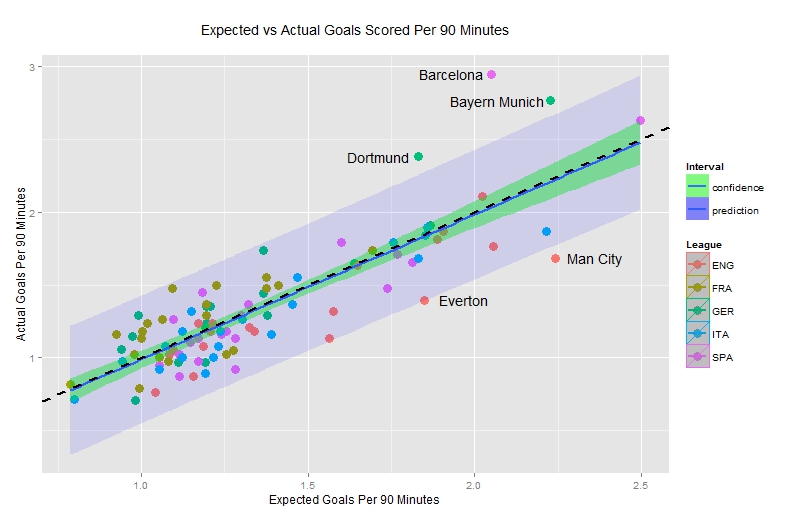
The blue line is a simple linear regression whereas the black dashed line is the equality line i.e. when teams have scored the same amount of goals they were expected to do. The green area highlights the confidence limits for the model fit whereas the blue area presents 95% prediction limits for individual teams.
In other words, we expect approximately 5% of the number of teams to fall outside of the blue band. The fact that both lines appear very close and the model appears to be a very good fit is reassuring. It suggests that ExpG is on average a good metric or even a substitute for actual goals, because it doesn’t consistently over- or under-estimate the number of goals a team/player will score.
Barcelona, Bayern Munich and Borussia Dortmund have actually scored a significantly higher number of goals compared to what they were expected to do, given the type of chances they were presented with whereas Everton and Manchester City have vastly underperformed in this area.
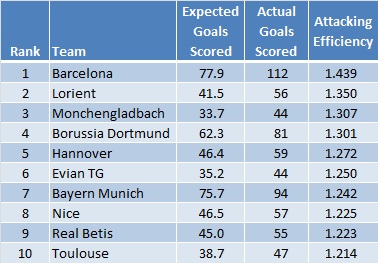
Somewhat surprising, neither Bayern Munich nor Borussia Dortmund has the second highest shooting efficiency after the Catalans. Remember that shooting efficiency is defined as the number of actual goals divided by the number of expected goals, i.e. the slope of the dashed line. So the second prize goes to … (drumroll!):
… Lorient! Scoring a total of 56 goals whereas given their chances, they were expected to just score 41.5 goals, registering an attacking shooting efficiency of 1.35. Intriguingly enough, all but 1 Lorient players expected to score at least 1 goal registered above average efficiency. A further look at the Top 10 teams in terms of attacking efficiency reveals no English or Italian team excelling at this measure.
The top ranked Italian team and 16th overall is Catania with an attacking efficiency rating of 1.144 while champions Juventus appearing in 81st place out of 98 teams with a rating of 0.843. The 3 English teams with above average efficiency are Aston Villa (ranked 27th overall with 1.055), Man Utd (ranked 32nd overall with 1.041) and Swansea (ranked 40th overall with 1.020). Other notable teams include Real Madrid (30th with 1.054), PSG (38th with 1.025), Chelsea (50th with 0.980), Arsenal (56th with 0.961) and Liverpool (79th with 0.858).
Shooting Efficiency in Defensive Terms
To win matches, a team does not only need to score goals but defend against them too. It’s therefore only natural to look at the same measure (shooting efficiency) but in defensive terms.
Which were those teams that defended well enough to prevent their opponents from scoring the number of goals their chances should have allowed them to do?
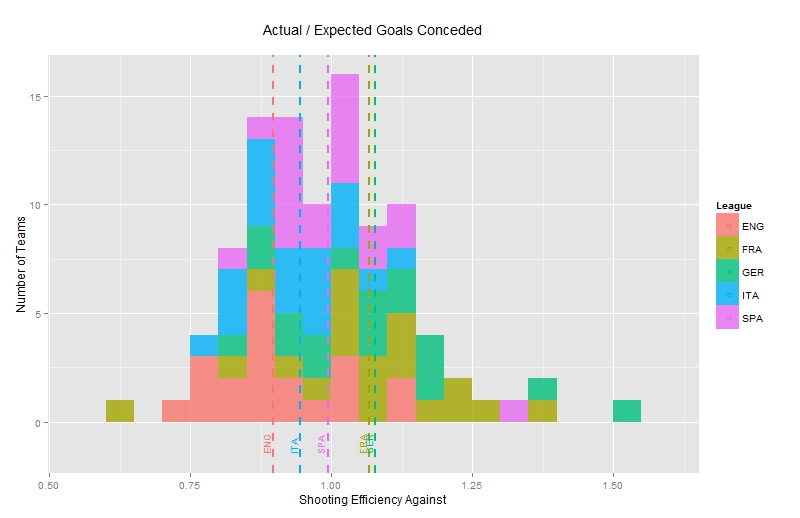
Once again as would be expected, most of the teams have close to average figures. Numbers above 1.00 indicate teams which conceded more goals than were expected to do whereas teams which register small numbers highlight teams with defences that prevented their opposition from scoring their expected numbers.
A single French team (PSG) comes on top of this metric with a value of 0.65 which translates to 35% fewer goals conceded than what would have been expected under this analysis. Bottom of this statistic, one can find Hoffenheim who conceded 66 goals whereas based on our research the chances the opposition had would only justify conceding 43.2 goals.
Looking at the actual and expected number of goals conceded per match an interesting issue appears. The equality line between actual and expected goals does not fall within the fitted line’s confidence limits. This could be down to the particular dataset (as the points only correspond to the 2012-2013 performance of these teams) or it could be a result of the fact that the ExpG model was based on data from the attacking side given the lack of defensive statistics. Perhaps further research is needed on this.
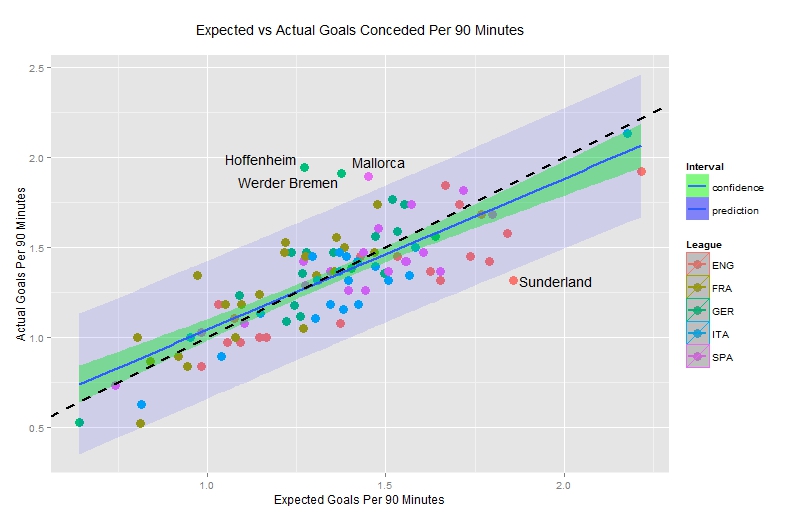
Other than Hoffenheim, Werder Bremen and Mallorca also let in a significantly larger number of goals than what they were expected to do whereas on the other side, Sunderland were the pick of the teams who conceded fewer goals to what was expected of them.
This ties in well with other pieces such as Colin’s one here on the performance of Simon Mignolet as well as the suggestion that Sunderland were probably the “luckiest” of the teams in 2012-2013 which weren't relegated. Following PSG, the Black Cats also have the second best shooting efficiency against at 0.71.
A full Top 10 in terms of defensive efficiency:
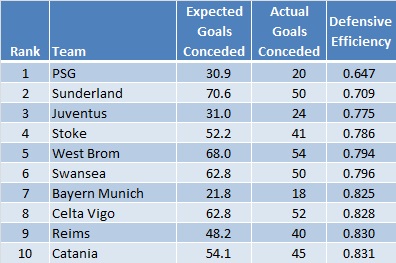
Notable teams which are missing from the table include Man City (ranked 15th with 0.857), Man Utd (22nd with 0.872), Arsenal (27th with 0.891), Chelsea (35th with 0.921), Real Madrid (46th with 0.978), Liverpool (63rd with 1.028) and Barcelona (67th with 1.045).
Overall Shooting Efficiency
Bringing it all together and looking at shooting efficiency For and Against (or attacking and defending) we visualize the data in the following way:
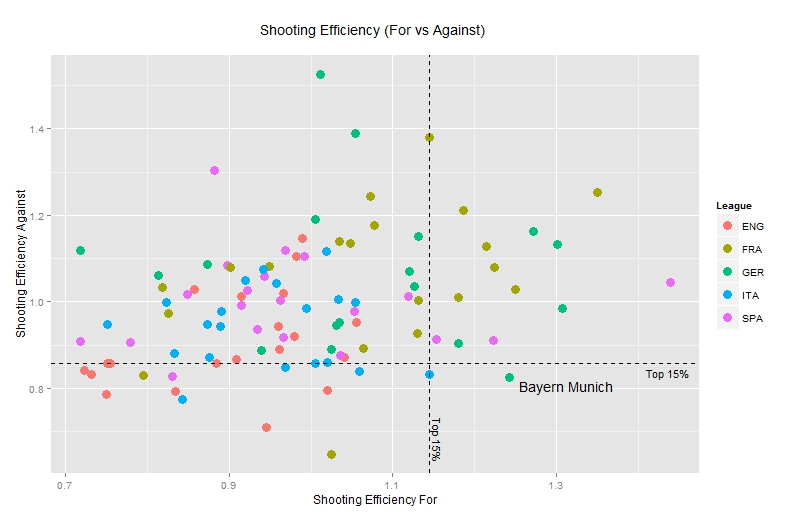
Points on the right hand side of the plot are efficient teams in terms of their attack i.e. they score more goals than expected given the quality of chances they were presented with.
On the other hand defensively efficient teams occupy the lower part of the plot, because the number of goals conceded is lower compared to its expectation.
Not a lot of teams excel both in terms of attacking and defensive efficiency. In fact, if we were to create quantiles and slice the data in terms of Top 5%, Top 10%, Top 15% etc for the two types of efficiency, the only team that appears in the Top 15% in both measures is the Champion League holders Bayern Munich with Catania (!) only missing just.
There is no single way to combine the two types of efficiency so in addition to the above hierarchy we could look at a different measure such as the ratio between Attacking and Defensive Efficiency. The higher the ratio the more efficient a team is overall. To visualize this we can plot lines on which this ratio is constant.
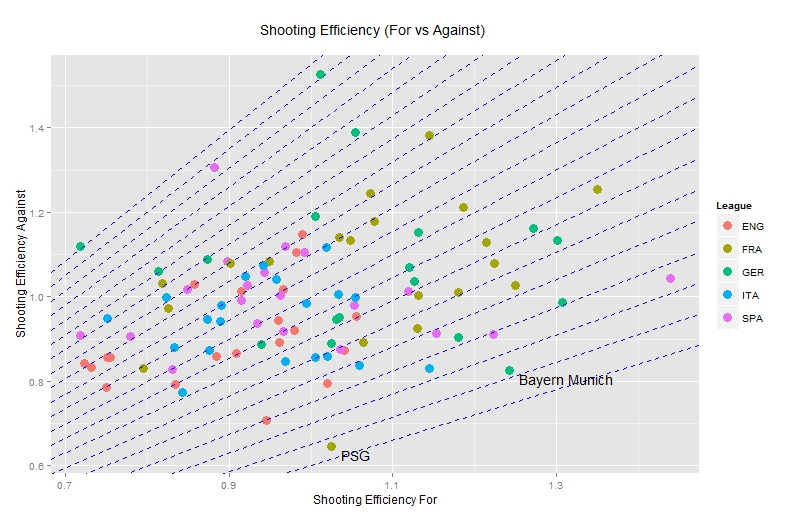
The flatter the line the more efficient a team is so in terms of this statistic PSG register the highest overall efficiency of 1.585 (attacking efficiency of 1.025 divided by defensive efficiency of 0.647) followed by Bayern Munich at 1.505. In table format, the Top 10 teams in overall efficiency are:
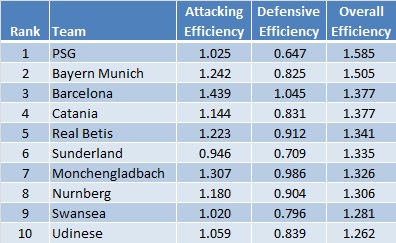
Some surprising names in this list perhaps but a nice spread with all leagues represented in the top 6. Notable exceptions include Man Utd (ranked 14th with 1.193), Juventus (29th with 1.088), Arsenal (32nd with 1.079), Real Madrid (34th with 1.077), Chelsea (36th with 1.064), Man City (74th with 0.877) and Liverpool (86th with 0.834).
Conclusion and the Way Forward
This piece was an introduction of the ExpG which is designed to estimate a shot’s goal expectation.
Armed with this measure, we can look at how teams or players have fared in terms of the number of goals scored or conceded relative to their respective expectations and derive efficiency figures for the attack or defence.
ExpG allows the analyst to compare figures which have been adjusted for a number of factors affecting goal expectation, indirectly placing these figures in context, thus making comparisons across teams or players more relevant. This also presents huge scope for further analysis, looking at individual teams or players and throwing more light into understanding what football statistics really mean.
