Football is a results driven business and it is very difficult to overlook the goals for and against numbers when assessing a team or a player. For an attacking player to be deemed a success he simply has to contribute to the team’s goal tally, but this results orientated focus can sometimes leave players trailing in its wake; often through no fault of their own. On Saturday morning I read the following tweet from Stephen McCarthy:  It does seem to be the general consensus that although Stewart Downing creates quite a few chances they are not good quality ones. Assist creation is an unusual task, in that after the chance is created the passer can’t do anything but watch and hope that the subsequent shot is scored. At this point he cannot influence the shot, but his reputation depends on how that shot is finished. It’s human nature to want to be in control of our own reputation, so it seems a little unfair that this is the life of chance creators. If you don’t believe me, ask Stewart Downing. The opening paragraph of this piece from EPLIndex seems to sum up the general perception of Downing:
Most football fans recognize Liverpool winger Stewart Downing as one of the biggest transfer flops in Anfield history. Bought from Aston Villa for around £20 million in 2011, Downing was a part of Kenny Dalglish’s FSG financed summer spending spree that included the purchases of Jordan Henderson, Charlie Adam, and Brazilian goalkeeper Doni. Downing, along with the other new signings, suffered an absolutely miserable start to his Anfield career by all accounts, failing to score a single goal or record a single assist during his debut EPL campaign with the Reds last year.
Downing Chances Created As usual, I have incorporated stats from various providers of Opta generated data and have compiled detailed numbers on Downing’s Key Pass (chances created) from the beginning of the 2011/12 season: 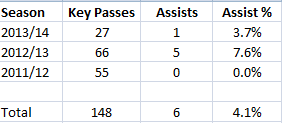 Over the last two and a half seasons, Downing has created 148 shots, but only 6 of them have been converted into goals. This conversion rate of 4.1% is far below the average shots success rate of 9% - 10%. His 2011/12 season at Liverpool was exceptionally poor with the creation of 55 chances but remarkably none of them were scored. It was his lack of returns in this season that prompted the opinion given in the EPLIndex article quoted above. The scoring rate associated with the chances he created last season were much more in line with the league norm, but unfortunately the conversion rate of his chances created this season are once again disappointing. Just 1 goal has been scored from the 27 shots he has set up for so far this season. Given the poor conversion rate it is perhaps understandable that people seem to consider the value of a Stewart Downing Key Pass as being less likely to result in a goal than the average Premier League chance created. The most common reason for this (at least according to my Twitter timeline) is that he seems to cross a lot and there is an assumption that a substantial amount of his key passes create headed chances which, we know, are less likely to result in a goal than a shot from similar locations. ExpG I wanted to go beyond just the raw goal numbers to try to get a better understanding of why the conversion rate on Downing’s chances created is so low. Is he really creating worse quality chances than almost any other player in the Premier League? I’m using the ExpG1 and ExpG2 metrics, created in conjunction with Constantinos Chappas. First of all a brief reminder as to what the two measures represent: ExpG1 – is the Expected goal value of a shot at the time that the shot is ABOUT TO BE taken. This calculation takes into account many factors such as shot location, whether the shot was a header or struck with the foot, the location and type of pass. ExpG2 – is the Expected goal value of a shot AFTER the shot has been struck. This takes into account all of the factors used in ExpG1 but is weighted much more towards the intended location of the shot. A shot that is blocked or off target would have an ExpG2 value of zero (as the shot cannot be scored), whereas a shot aimed for the very top corner might have a probability approaching 1.00. I think it is important to use both ExpG measures in tandem for this analysis. Although we feel that ExpG1 is as accurate an estimate of the probability of any shot being scored, I am aware that defensive pressure is lacking from its calculations. If the mechanics of our ExpG1 calculation were incorrect then it could be possible that we could be returning a higher goal probability than is justified for any individual attempt. In this specific case, perhaps Downing’s chances tend to be given to players who are heavily marked, to players who are given the ball on their weaker foot or to players who are at full stretch and so can’t get adequate purchase on the shot. ExpG1 would not be able to pick this up, but ExpG2 would catch this effect. If a player shoots under a lot of pressure then there is a greater chance that the shot will either be blocked or be harried into shooting wide. Likewise, if a player is shooting at full stretch he may struggle to hit the target. In both of these scenarios the ExpG2 values would be zero as the goalkeeper hasn’t had to make a save and thus a goal can’t be scored. The other main advantage of using ExpG2 is that it controls for goalkeeping performance. The ExpG2 of a shot aimed towards the top corner will be much higher than one destined for the centre of the goalmouth, and the ultimate outcome of the shot (goal or save) does not have an impact on the ExpG2 value. As mentioned earlier, the act of finishing the chance is entirely up to the striker and Downing can have no additional influence on it but it is my assumption that over the course of a season the total of ExpG2 will reflect the quality of the assists. This is because he won’t be creating chances for just one specific player, but rather he will create shots for a spread of his teammates; all of whom will have varying finishing abilities. The use of both ExpG measures can let us objectively look at the quality of chances that Downing has created over the last two and a half seasons and we can go beyond relying on the actual number of goals scored. Downing's Numbers
 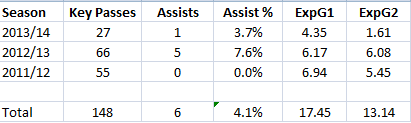 We’ll start with the awful 2011/12 season where we maintain that the 55 shots he created had an expected goal total of 7 at the point the shot was taken and 5.5 after the shots and headers were struck. Somehow, however all 55 of those chances were missed. Downing’s critics will say that there has to be some reason why he could create 55 chances yet not see one of them being scored; it can’t all be down to bad luck. Downing did have one sympathiser in my timeline during the subsequent discussion on Saturday morning:
  For what it’s worth, I too share @The_Woolster (Ben’s) view that Downing was in fact exceptionally unlucky during the 2011/12 season. Remarkably, when taking into account the placement of the shots that came from his passes he should have been responsible for creating 5.5 goals, which would have been exactly 10% of the number of chances he created. Needless to say, there is quite a lot of difference between creating 0 goals and 5.5 goals. So what happened? A very enlightening comparison can be made between Stewart Downing and Chris Brunt using their 2011/12 stats.
 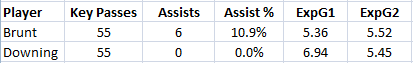 I have chosen Brunt as a comparison as he and Downing are wingers and they both generated 55 chances during that season. The ExpG1 of chances created by Downing was slightly higher than Brunt’s but both players’ chances generated an ExpG2 (probability of a goal being scored when final shot placement is taken into account) of 5.5 over the course of that season. One other interesting similarity is that both players created approximately half of their chances by way of crossing; Downing had 29 and Brunt 28 crosses. So both players had almost identical statistics, apart from the one that matters. The West Brom players on the end of Brunt’s passes managed to convert 6 of them into goals. Unfortunately, during the 2011/12 season Downing’s Liverpool teammates weren’t nearly as efficient with his chances. I appreciate that those numbers may be difficult to accept. How can two players generate chances that have the same aggregate probability of being scored yet one player sees 6 of them converted (which is almost exactly in line with expectations), and the other zero? I think that the following shot placement plots can help us understand this. These shot plots show the shot placement for every non blocked shot that resulted from the players’ key passes. Brunt
 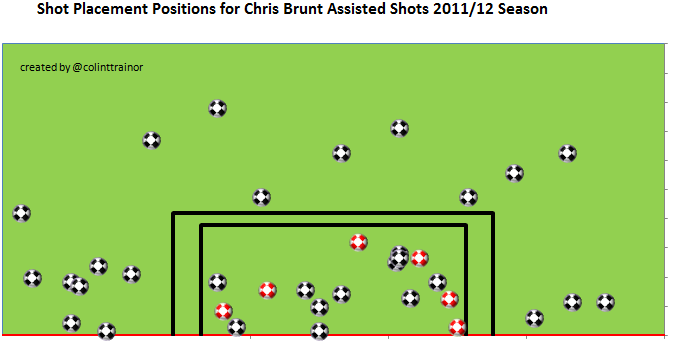 Goals are signified with red coloured balls and we are viewing the goalmouth from the striker's viewpoint. Downing
 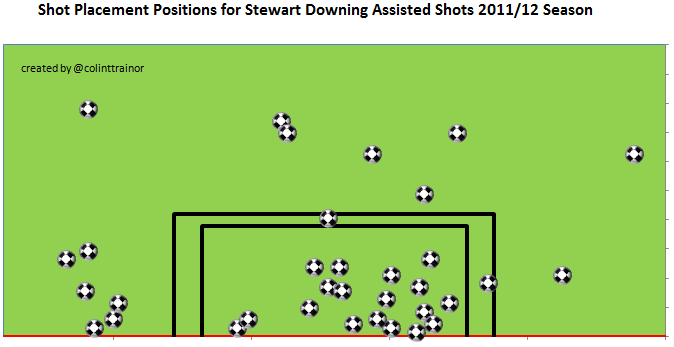 Common wisdom would suggest that as Downing was 0 for 55 the chances he created must have been of low quality. I think that the above plots suggest that this was not the case. 19 of the shots Downing created were on target and a further two hit the woodwork; quite a few of the shots were hit centrally but opposition goalkeepers were made to work and that shot pattern is definitely not consistent with a return of 0 goals. Compare that to Brunt’s output. 18 of the Northern Irishman’s chances were put on target and 6 of them were scored. This in itself is not remarkable as the percentage of on target shots that are scored is approximately 30%. What is more remarkable is that Downing seen his strikers go 0 or 19 on their shots on target. Other than looking at each of the 55 chances Downing created on tape I have done all the analysis I can using the available data, which I think is enough to suggest that he was exceptionally unlucky in the 2011/12 season. The ExpG2 for the shots he created suggested he should have provided 5.5 goals and the subsequent shot placements for those chances confirmed that a return of that magnitude was indeed deserved. Unfortunately for Downing, it seems that people need to see goals being put on the scoreboard to appreciate the chances that players create. I would contend that his return of zero goals in 2011/12 was simply due to variance and not that the chances he creates are somehow less valuable than the average Premier League player. No discussion is required for the 2012/13 season as the chances he created were converted roughly in line with what our model predicted for him; 5 goals versus an expected total of 6. Current Season Then we arrive at his numbers for 2013/14; and they aren’t good. His 27 key passes have created just 1 goal, compared to an ExpG1 value of 4.4 and an ExpG2 total of 1.5. From my point of view, the difference between the two ExpG metrics is worrying. At the point the shots are about to be taken our model has expected 4 goals, yet as soon as the shots have been taken that goal expectation rapidly drops to just 1.5 goals. It’s therefore no surprise to see that only 1 goal was actually scored from Downing’s key passes in the first 14 weeks of the current season. It is a possibility that the decrease in goal expectation is as a result of chances that aren’t as strong as they appeared to be on the ExpG1 measure. However, after demonstrating that in the previous seasons Downing’s chances were no worse than our model initially suggested perhaps there is another reason why the chances he is creating are being finished so poorly this season. Last summer Downing made the move from Liverpool to West Ham, and in many games this season West Ham has found themselves playing without a recognised striker. Even when they have started with a forward the injury to Andy Carroll has meant that the player handed the start probably isn’t Sam Allardyce’s first choice option. Here are the attacking numbers for West Ham this season:
 ![]() Although the scale of the decrease isn’t quite as marked when looking at West Ham as a whole, we see that the Hammers have big problems in front of goal. Perhaps the lack of a main striker or the attacking strategy that West Ham employs can explain the very large decrease between ExpG1 and ExpG2. Either way, this decrease (the largest in the league) clearly shows West Ham have performed abysmally in converting the chances they have created. So where does that leave us with Downing in the 2013/14 season? Unlike the previous two seasons, there could be cause for claiming that the chances he has created this season have been poor. However, when I parlay the fact that he did create good quality chances in the two previous seasons with the wider shot conversion issue that is unfolding at Upton Park this year then I’m tempted to give him the benefit of the doubt for a little while longer. However, there is one thing that I am sure of. His return of 0 assists in 2011/12 for Liverpool was not down to the poor quality of his chances but rather was attributable to some bad luck, poor shooting and excellent opposition goalkeeping performances. Unfortunately for Stewart Downing, it doesn’t take much to earn a reputation; deserved or otherwise.
Although the scale of the decrease isn’t quite as marked when looking at West Ham as a whole, we see that the Hammers have big problems in front of goal. Perhaps the lack of a main striker or the attacking strategy that West Ham employs can explain the very large decrease between ExpG1 and ExpG2. Either way, this decrease (the largest in the league) clearly shows West Ham have performed abysmally in converting the chances they have created. So where does that leave us with Downing in the 2013/14 season? Unlike the previous two seasons, there could be cause for claiming that the chances he has created this season have been poor. However, when I parlay the fact that he did create good quality chances in the two previous seasons with the wider shot conversion issue that is unfolding at Upton Park this year then I’m tempted to give him the benefit of the doubt for a little while longer. However, there is one thing that I am sure of. His return of 0 assists in 2011/12 for Liverpool was not down to the poor quality of his chances but rather was attributable to some bad luck, poor shooting and excellent opposition goalkeeping performances. Unfortunately for Stewart Downing, it doesn’t take much to earn a reputation; deserved or otherwise.